
New Zealand is filled with the descendants of great voyagers who left their homes in far-off lands for a new life in this idyllic land. This mass immigration has created a diverse melting pot of immigrants from across the world. Along with these human settlers, other, smaller and furrier immigrants also arrived – stowaways hidden away in the supplies below decks… who similarly found New Zealand an irresistible new home.
The first rodent explorers that journeyed across the oceans to New Zealand were the kiore, or Polynesian rat, who travelled alongside the Māori, arriving around 1280 AD. The whakapapa of kiore has helped reveal the routes and timing of the great Polynesian voyages across the pacific. Later, from the 1820s onwards, other rodents including the house mouse arrived hidden away in the supplies of boats coming from all around the world with settlers, sealers, whalers, and traders.
These mice are, like its people, diverse, with whakapapa tracing across the globe. Traces of this ancestry can be uncovered from the DNA of the mice now living here, and from this information we can tell an amazing story of colonization, invasion, replacement, and population mixing.
First, some background on tracing origins through DNA…
We all have two different kinds of DNA in our cells – Mitochondrial DNA which is inherited maternally (only from your mother), and nuclear DNA which is inherited from both parents. Mitochondrial DNA codes for only one process – generating energy in the cells. Nuclear DNA on the other hand, determines everything else about you – how you develop, the color of your eyes and hair, even whether you sneeze when you look at the sun, or if you can smell asparagus urine.
Because Mitochondrial DNA is inherited along one ancestral line without mixing, it is an ideal marker to trace your origins. The majority of scientific research tracing origins using DNA – literally thousands of studies, have primarily focused on mitochondrial DNA. Analyses of human Mitochondrial DNA were the first to suggest the ‘recent out of Africa’ hypothesis, showing that all living humans could trace their maternal ancestry to a single woman living in Africa around 190,000 years ago – a woman who we have christened “Mitochondrial Eve”.
Just like humans, mice have a fascinating diversity of genes, which when analyzed can show how their populations have expanded and evolved. In their native range, the species Mus musculus – better known as house mice, consists of three closely related subspecies with largely separate distributions: M. m. musculus found in Eastern Europe and Northern Asia, M. m. castaneus found in Southeast Asia and India, and M. m. domesticus, native to western Europe, the Near East, and northern Africa. These three subspecies look different to each other (at least to a trained eye) and they are genetically quite distinct, having evolved separately for around 350,000 years.
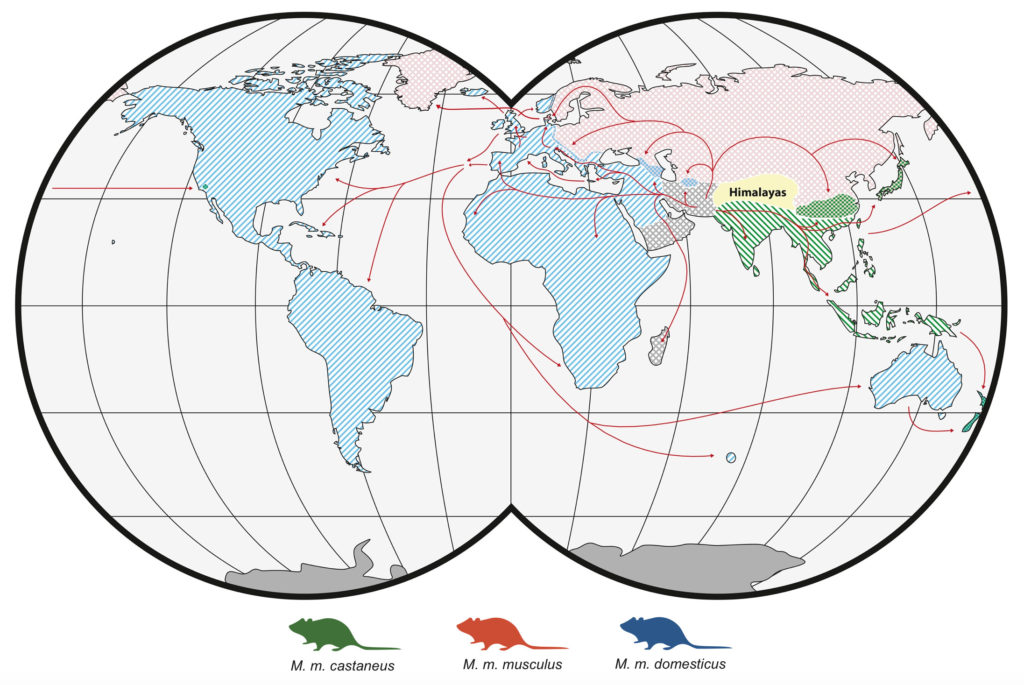
Figure 1. The distribution and colonisation routes of each of the three mouse subspecies. Note that New Zealand has ancestry from all three subspecies.
A few years ago, Professor Carolyn King from Waikato University and I collaborated on a project looking at the mitochondrial DNA of mice in New Zealand. In this study, we found a diverse genetic suite, with a huge diversity of mice from western Europe (M. m. domesticus), East-Asian (M. m. castaneus) mice on Chatham Island and in the south of the South Island, and mice from all three subspecies in Wellington. We found that New Zealand is therefore unique in the world in having all three subspecies introduced, mixing and hybridizing. Hybrids between subspecies are known to have numerous genetic problems, and in particular, domesticus/castaneus hybrids have rarely been studied in the wild due to genetic incompatibilities and non-overlapping ranges. This makes studying the genetics of New Zealand mice extremely interesting.
While we found out that mice had arrived many times, from many places, we still didn’t really know the full story of this complex history of immigration.
Where exactly did all of these mice come from, and how have they mixed since they got here?
We couldn’t answer these questions with mitochondrial DNA alone, so we looked at cutting edge technology recently developed for looking at the mouse nuclear genome. Because mice are a model organism used in biomedical and developmental biology research, cheap genomic marker sets have been developed for analyzing their genomes. We took advantage of these marker sets, and sequenced ~150,000 SNPs for 161 mice from across New Zealand. A Single Nucleotide Polymorphism (SNP) is a change in a single base pair of DNA, and since we were using the same ones that biomedical researchers use there is a wealth of information about the genes responsible for various traits in our data.
What we found was extremely surprising…
The hybrid domesticus/castaneus populations in New Zealand on Chatham Island and in the southern half of the South Island are actually hybrids only in the very limited sense: they have different mitochondrial and nuclear ancestry. Both of these populations are essentially pure M. m. domesticus across the nuclear genome, but they retain the mitochondrial ‘ghosts’ of a previous hybridization event which failed to lead to nuclear genetic mixing in the long term. No traces of their Asian ancestry remain in their nuclear genomes. We had previously thought that these mice had come directly from China, perhaps from sealers returning from the Canton fur markets, but now we can see that almost all of their ancestry came from western Europe!
To put how unusual this in context, it would be similar to you going to the doctor for a genetic test, and being told that one of your mother’s relatively recent ancestors was a chimpanzee – these mice had the wrong mitochondrial genomes!
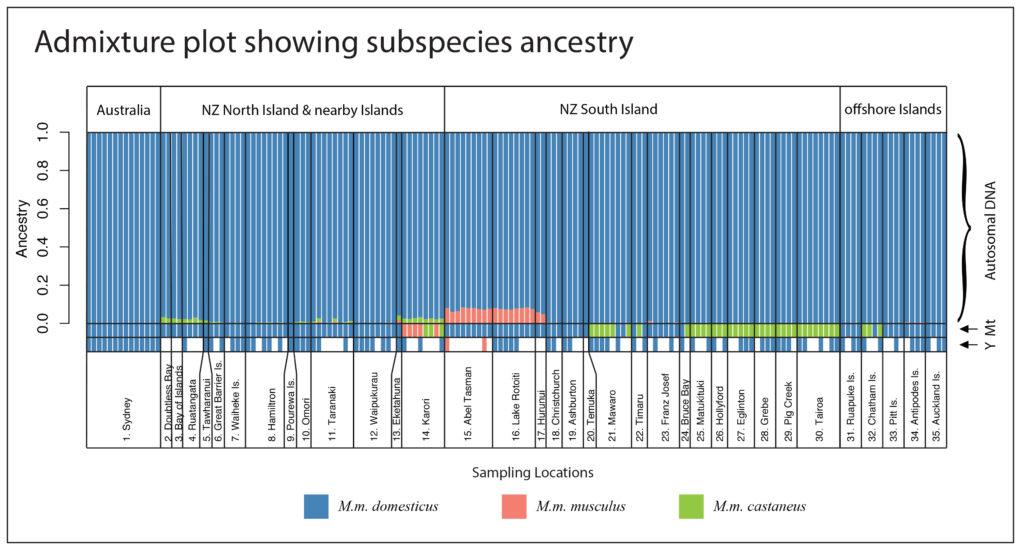
Figure 2. Ancestry plot for all mice sampled in the study. Each mouse is a single column, and the proportion of ancestry to each subspecies is shown by colour. Autosomal DNA is nuclear DNA excluding the sex chromosomes, Mt is Mitochondrial DNA, and the Y chromosome is indicated by Y (for males only).
The spatial patterns of ancestry for mice across the country therefore was therefore completely different from what we had believed given the mitochondrial data!
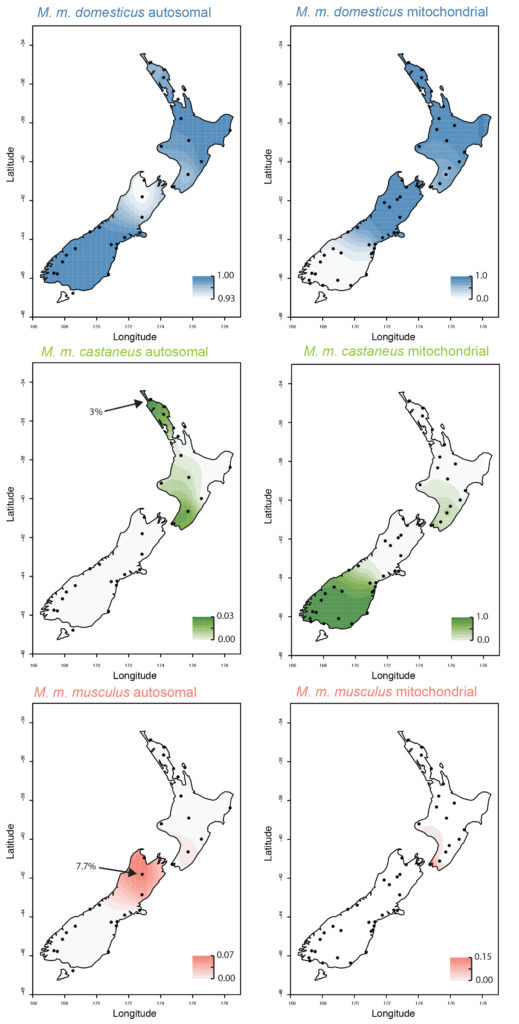
Figure 3. The spatial patterns of ancestry of New Zealand mice, as interpreted from nuclear (autosomal) and mitochondrial DNA.
How could this happen?
Having mitochondria that don’t match the rest of your genome is not as strange as it sounds, because of the different ways the two kinds of DNA is inherited. When an M. m. castaneus mother mates with an M. m. domesticus father, their offspring are 50:50 domesticus/castaneus at a nuclear level, but 100% castaneus mitochondria. If the female offspring were then to mate with an M. m. domesticus male, on average they would be 25% castaneus, 75% domesticus for nuclear DNA, but still 100% castaneus for their mitochondria. After only six generations, they are over 98% domesticus, though still retaining the castaneus mitochondrion. This assumes that survival is even among the offspring, however if hybrids are less fertile or have a higher mortality then those offspring that are closer to ‘pure’ will survive better and re-separation of the genomes can occur even more rapidly.
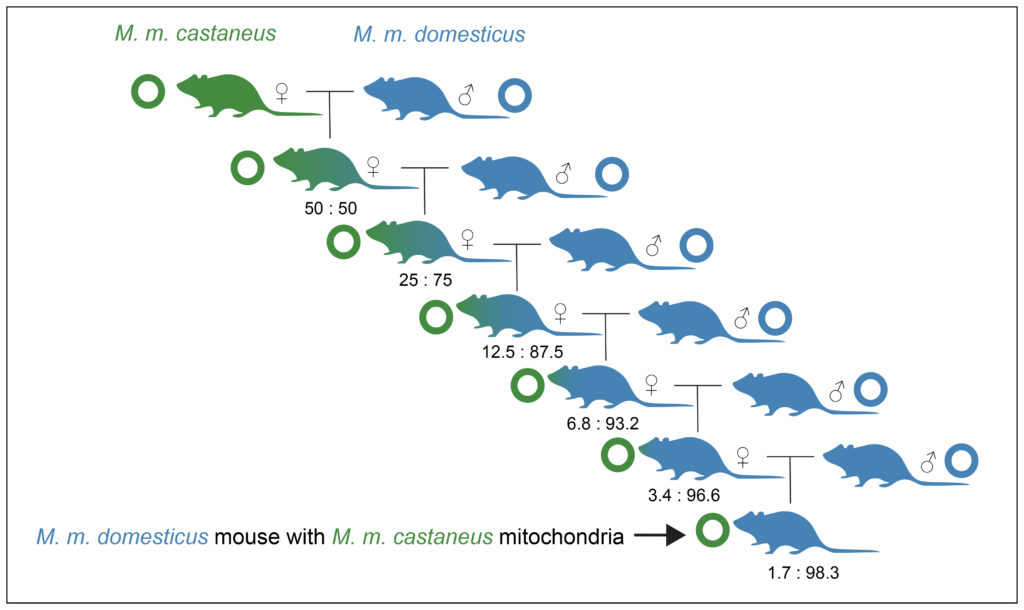
Figure 4. Diagram showing how, after only a few generations after hybridization, you can have individuals that are basically ‘pure’ to one subspecies, but that have the ‘wrong’ mitochondria.
This situation (called mitochondrial capture) would be particularly likely when the original population was small, and when the hybridization asymmetrical, with males of one subspecies mating with female of the other, but not the other way around. These are precisely the conditions that would have occurred on boats or in small founding populations in ports. Previous research has shown that there are severe infertility problems for crosses between mouse subspecies, particularly involving crosses involving male M. m. castaneus. Our findings show that in natural populations, the genomes of these two subspecies are so unstable when mixed, and the fertility of hybrids so significantly decreased, that they re-separate over generations, effectively rejecting the DNA of one of them from the population.
These differences in patterns of ancestry really change how we need to think about how we interpret ancestry based on mitochondrial DNA. We got completely different results trying to assess ancestry based on mitochondrial and nuclear DNA, and hence could not have understood the ancestry for New Zealand mice from only mitochondrial data. Many studies across the world rely on mitochondrial DNA to look at the history of populations, but our study highlights the need to be careful in interpreting these results.
In the next part, we will describe where New Zealand’s mice really came from, and what happened when they arrived.
Contact
Dr Andrew Veale
aveale@unitec.ac.nz
Leave a Reply